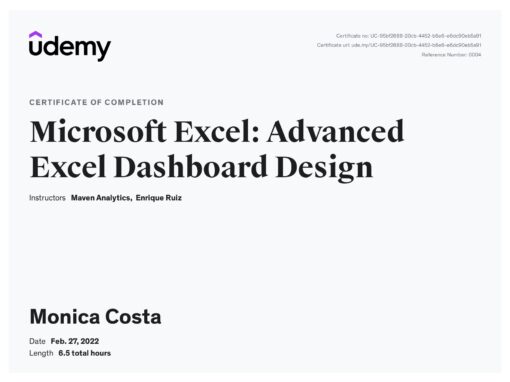
When Excel meets data visualization, reading and understanding complex information becomes a pleasant experience. Advanced use of Excel for the creation of dynamic charts and dashboards.
If you are guesssing how data visualization and information design can support marketing and business development, watch the video below.
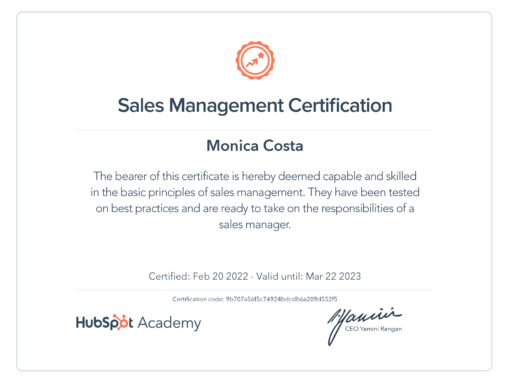
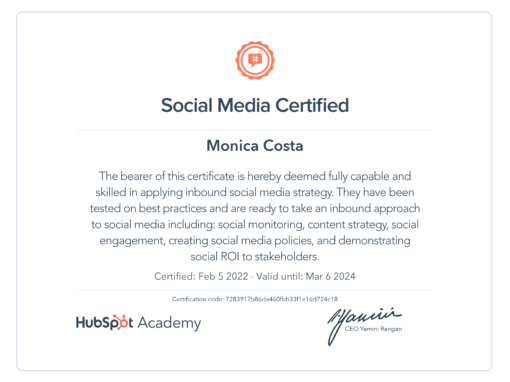
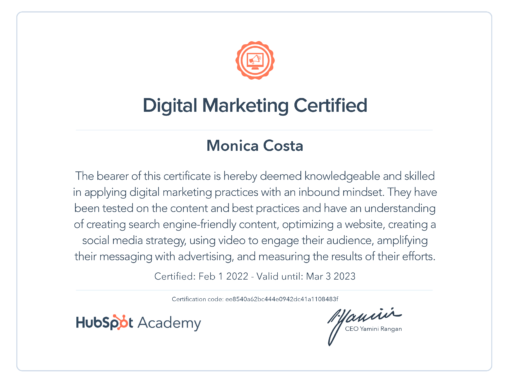
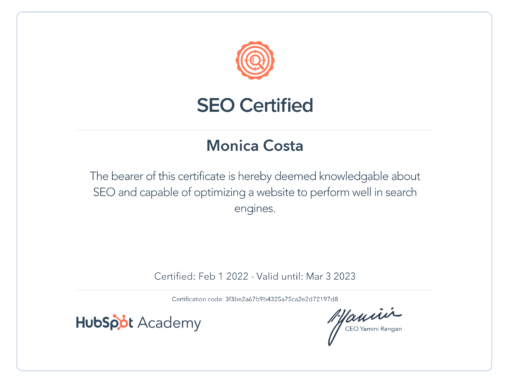
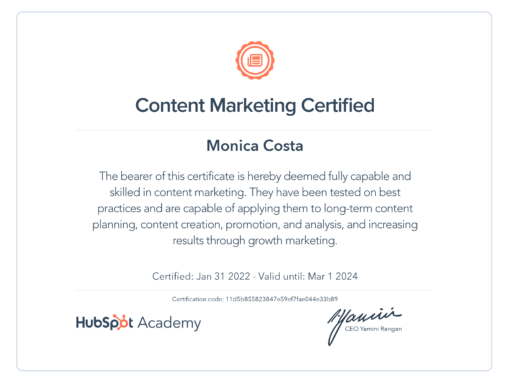
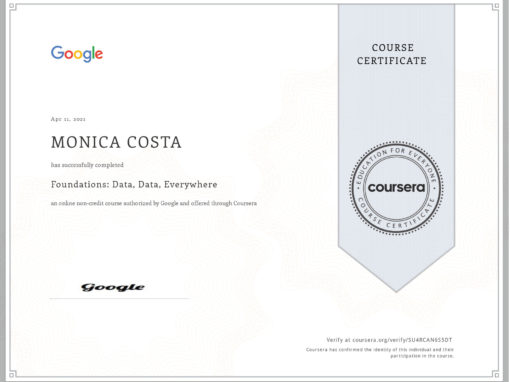
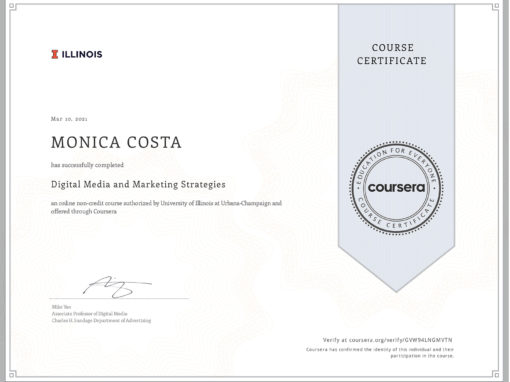
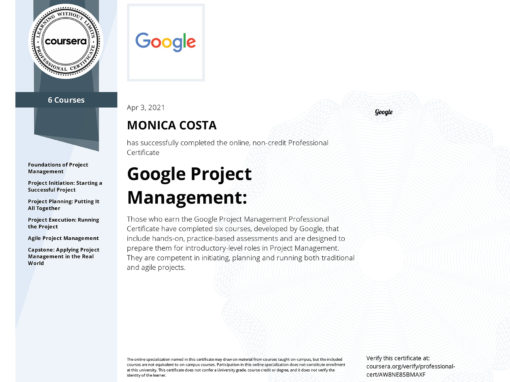
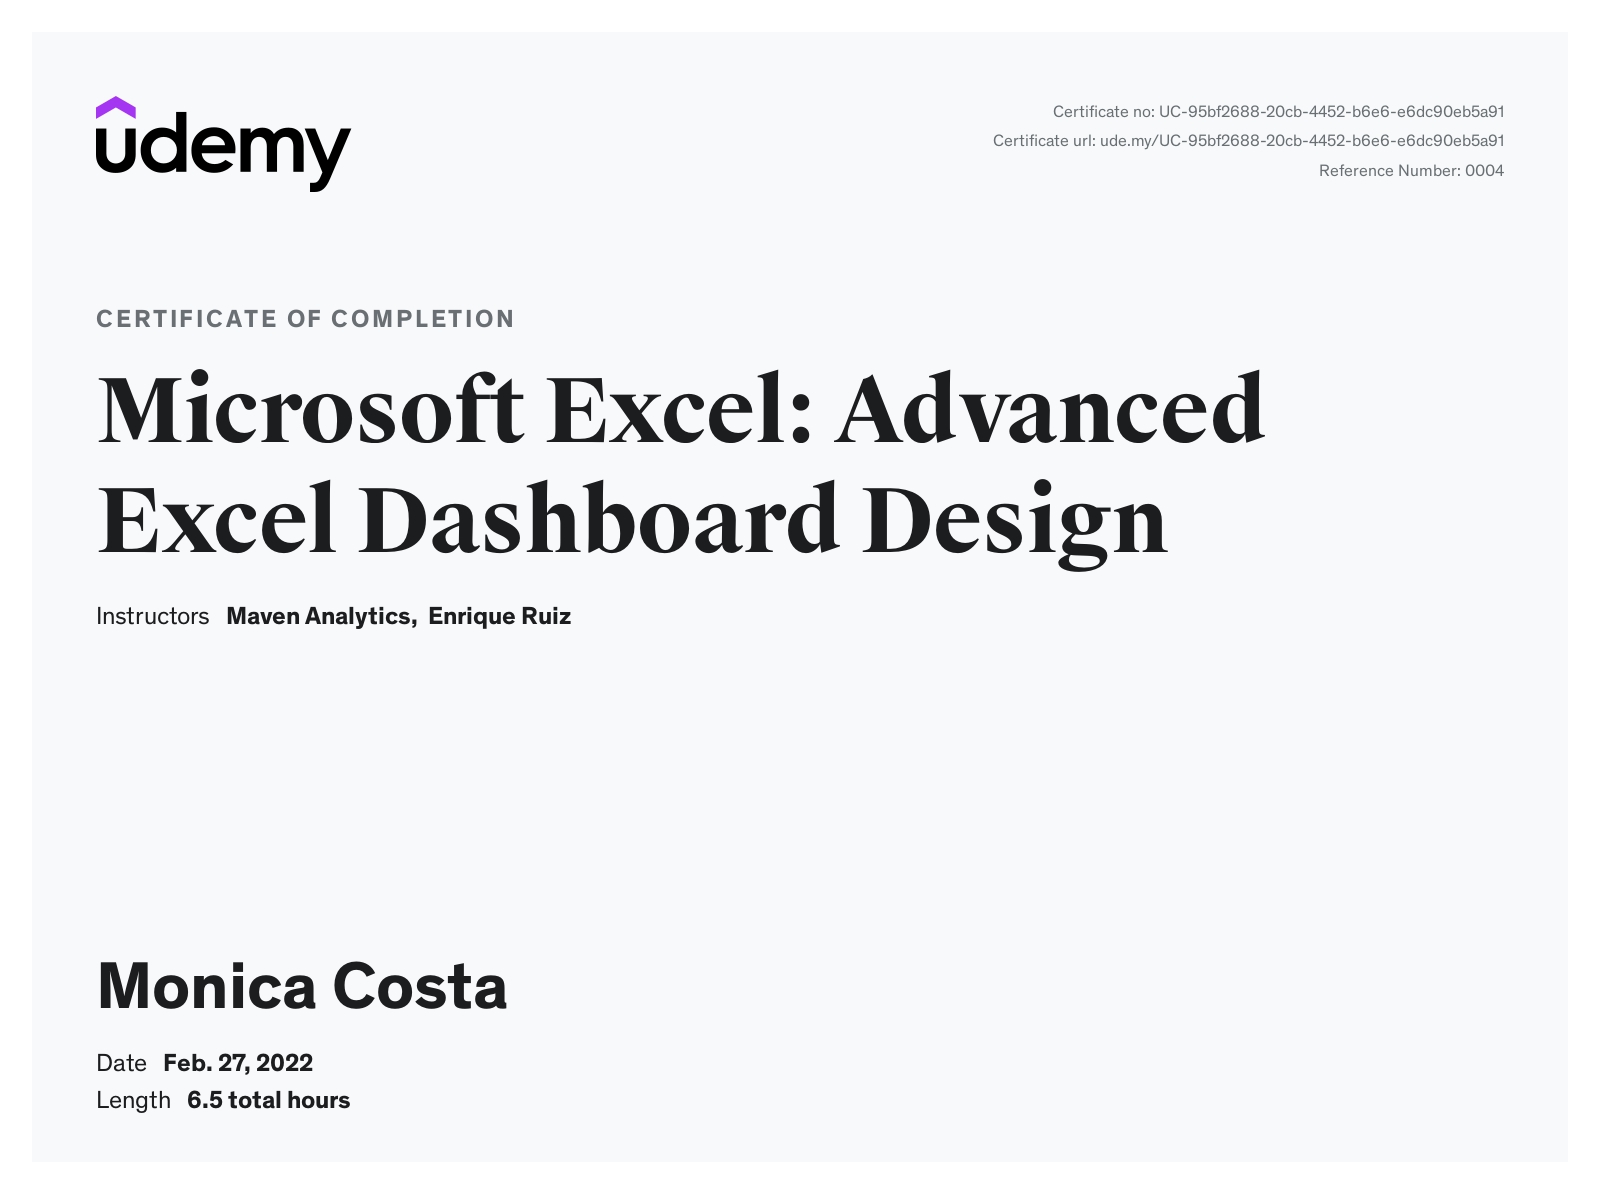
Here below few selected and recent Certificates and Accomplishments [ click for all certificates ]
